B2B INTEGRATION TOOL •GEN-AI PRODUCT •LOGISTICS AND SUPPLY
Designing a B2B AI tool to support the supply and
logistics industry
INTRODUCTION
This case study outlines the critical need for a new, efficient Chain Supply Vulnerability (CSV) product that focuses on identifying supply chain vulnerabilities associated with geopolitical risks. The new tool offers real-time insight into supply chain threats, combining predictive analytics, expert inputs, and data visualisation to support faster, more strategic responses. This case study outlines how we transformed a manual, reactive process into a more automated, confident, and forward-looking risk management workflow.
Role
Lead product designer
Timeline
4 months for MVP
Tools
Figma,GigJam, Jira Discovery, UserTesting, Google surveys

PROBLEM STATEMENT
The global supply chain has become increasingly complex and interdependent, especially as companies face challenges stemming from geopolitical uncertainties and market disruptions. Supply chain management now requires companies to address not only the likelihood of disruptive events, defined as risk, but also the inherent weaknesses in their supply chain structures, known as vulnerability.
Decision making impact
Without a unified system to measure vulnerability factors such as supplier concentration, country ownership, and spheres of influence, organisations are hindered in making informed, long-term strategic decisions.
Dynamic landscape
As geopolitical events unfold rapidly, there is an urgent need for a tool that can update real-time insights, enabling stakeholders to proactively address gaps in their supply chain.
MY ROLE
I led UX research, strategy, and interface design. Working closely with supply chain analysts, procurement leads, and internal risk teams, I was responsible for:
-
Mapping the end-to-end user journey
-
Creating personas to reflect varying regional and functional priorities
-
Designing wireframes, flows, and prototypes
-
Facilitating usability testing and synthesising feedback into actionable iterations
PROCESS
The design process involved:
-
Synthesising research into personas and a journey map
-
Exploring rough concepts and low-fidelity sketches
-
Defining key user flows (e.g., “flag a critical supplier”, “simulate a disruption”)
-
Designing mid- and high-fidelity screens with Figma
-
Conducting remote testing sessions with internal users to validate ease-of-use, relevance, and trust
RESEARCH INSIGHTS
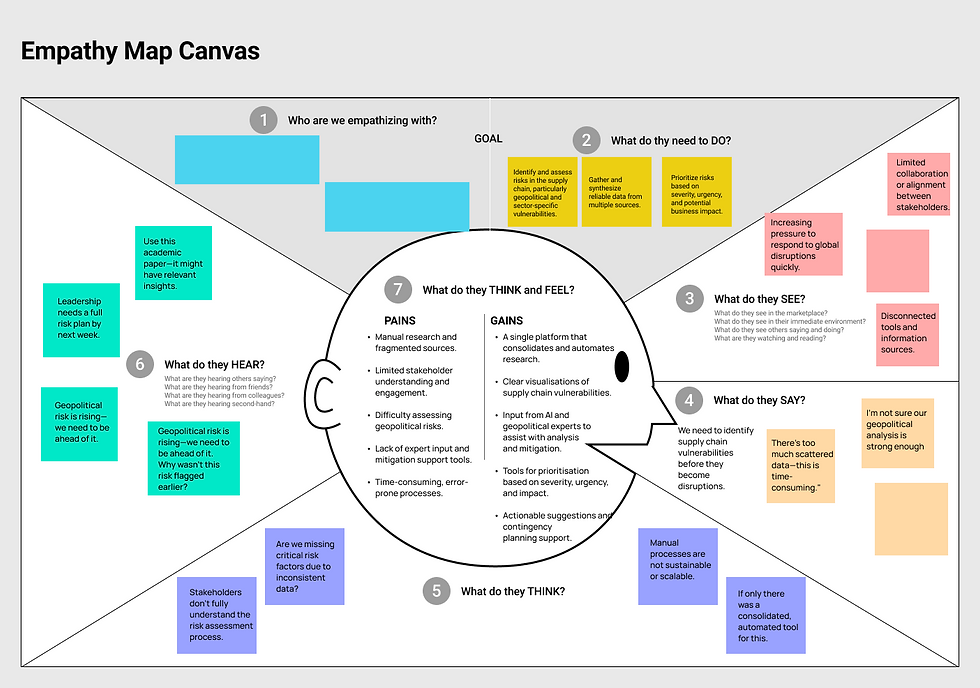
I began by mapping the current journey of a typical user like Mike Thomson, a senior supply chain analyst, to identify pain points and behaviours.
Key insights from our journey mapping and empathy work:
-
Users felt overwhelmed by fragmented data and struggled to see the bigger picture
-
Confidence dropped at the analysis and mitigation stages due to lack of clarity and tools
-
There was a desire to move from reactive “firefighting” to proactive, data-backed decision-making
-
Many users lacked access to geopolitical expertise and wanted better automation and expert suggestions


INSIGHTS
How might we design a user experience that effectively combines internal and external data for supply chain mapping, focusing on risk metrics to provide users with a comprehensive view of risks and accurate predictions based on data scientists' formulas?
Users are currently relying on manual research, internal data, or potentially fragmented tools to tackle supply chain challenges.
They face challenges such as lack of comprehensive insights, manual data gathering, and difficulty in assessing geopolitical risks.
While the customers share a general interest in supply chain mapping and risk assessment, they have different industry focuses, such as electric vehicle car batteries, financial services, extractive industries, etc.

SOLUTION
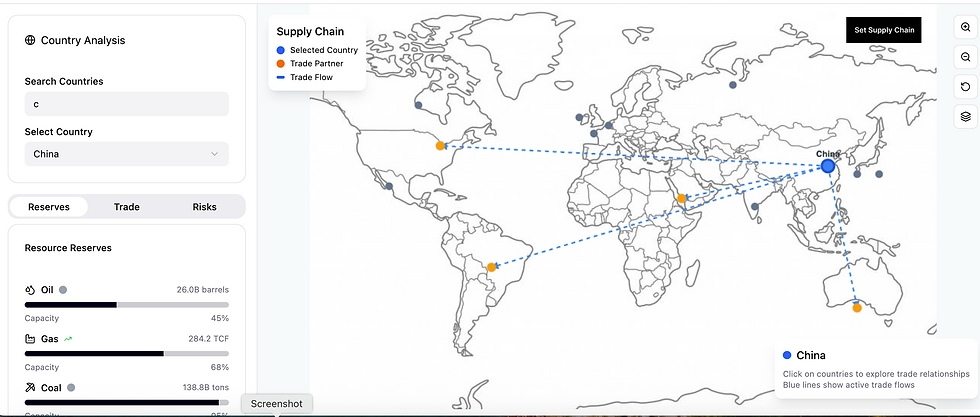
The final product was a streamlined, intelligence-led tool designed to bring structure, speed, and clarity to the way analysts assess and act on supply chain risks.
It provides a unified interface where users can monitor vulnerabilities, prioritise them based on urgency and impact, and access expert-backed suggestions for mitigation, all within a single workflow.
The platform integrates the four layers of analytics, descriptive, diagnostic, predictive, and prescriptive, so users can move from understanding past disruptions to confidently planning future actions.
A key feature is its seamless interoperability with Adarga Vantage, the company’s existing geopolitical research platform, allowing users to tap into real-time, context-rich insights from trusted sources without duplicating effort. This connection ensures that geopolitical context is no longer siloed from supply chain operations, but becomes a dynamic input in ongoing risk evaluation and response.


OTHER PROJECTS

Re-imagining the workflow to drive retention
